Creating a pivot table view with mixed granularity
Digest of some OBiEE errors (not necessarily NQSErrors)
October 30, 2009Admintool Check-in changes: Internal Assertion Error Condition
November 20, 2009Hello everyone.
I just realized that this post is inspired by Venkat.
I’m finally posting a solution to the problem I’ve identified a while ago related to a specific Pivot Table View. I think the final outcome should look something like this image:
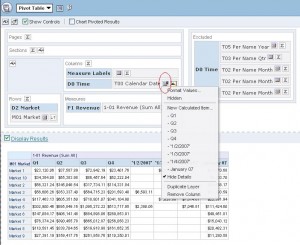
To get this result – I’ve used the “New calculated column” menu on the pivot table (circled in red):

OBIEE pivot table menu
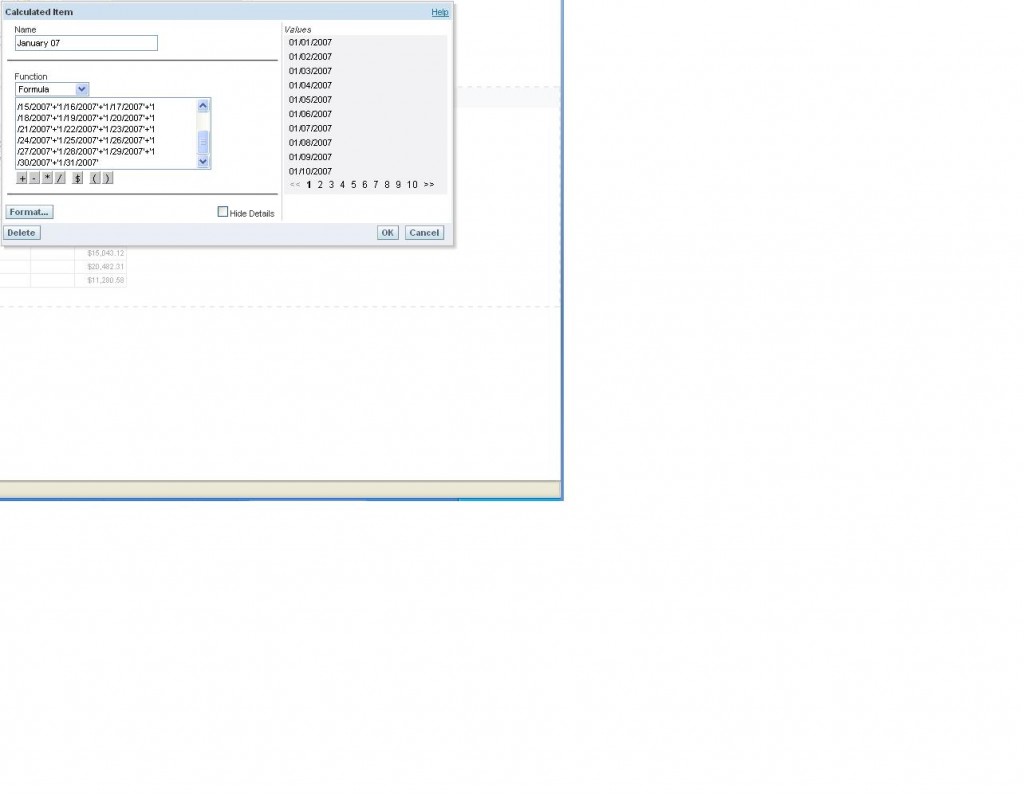
Then, what you really need to have in the Columns is the most granular level column (sounds redundant – in this case it’s a Date column). I used Excel to quickly generate formulas, such as this for Q1. It’s really easy to generate these formulas below. I hope it’s pretty self-explaining – you add things up in a granular level – this way you can combine things – that you wouldn’t be able to combine otherwise:
‘1/1/2007’+’1/2/2007’+’1/3/2007’+’1/4/2007’+’1/5/2007’+’1/6/2007’+’1/7/2007’+’1/8/2007’+’1/9/2007’+’1/10/2007’+’1/11/2007’+’1/12/2007’+’1/13/2007’+’1/14/2007’+’1/15/2007’+’1/16/2007’+’1/17/2007’+’1/18/2007’+’1/19/2007’+’1/20/2007’+’1/21/2007’+’1/22/2007’+’1/23/2007’+’1/24/2007’+’1/25/2007’+’1/26/2007’+’1/27/2007’+’1/28/2007’+’1/29/2007’+’1/30/2007’+’1/31/2007’+’2/1/2007’+’2/2/2007’+’2/3/2007’+’2/4/2007’+’2/5/2007’+’2/6/2007’+’2/7/2007’+’2/8/2007’+’2/9/2007’+’2/10/2007’+’2/11/2007’+’2/12/2007’+’2/13/2007’+’2/14/2007’+’2/15/2007’+’2/16/2007’+’2/17/2007’+’2/18/2007’+’2/19/2007’+’2/20/2007’+’2/21/2007’+’2/22/2007’+’2/23/2007’+’2/24/2007’+’2/25/2007’+’2/26/2007’+’2/27/2007’+’2/28/2007’+’3/1/2007’+’3/2/2007’+’3/3/2007’+’3/4/2007’+’3/5/2007’+’3/6/2007’+’3/7/2007’+’3/8/2007’+’3/9/2007’+’3/10/2007’+’3/11/2007’+’3/12/2007’+’3/13/2007’+’3/14/2007’+’3/15/2007’+’3/16/2007’+’3/17/2007’+’3/18/2007’+’3/19/2007’+’3/20/2007’+’3/21/2007’+’3/22/2007’+’3/23/2007’+’3/24/2007’+’3/25/2007’+’3/26/2007’+’3/27/2007’+’3/28/2007’+’3/29/2007’+’3/30/2007’+’3/31/2007′
Calculated item OBIEE
The same logic works for Q2,3,4. For individual dates, it would be the same idea:
And for months, it’s the same logic:

To sum up – by using the “calculated item” feature of pivot table view – you can create reports with mixed granularity on them. The pros are that you’ll be able to support legacy views (in some instances it’s absolutely critical to mimic existing view). The cons are that it involves some manual entry / data manipulation and that it’s not very flexible (I couldn’t find out how to use variables in this example).
Last thing – it seems as first column gets added on the left and the consequent ones to the right – keep this in mind while designing this view – since I’ve noticed you can’t really manipulate with the locations of the calculated columns.

6 Comments
Hi Andriy,
just one add-on: on order to make that calculation more dynamic you can always use the “$” notation to reference the nth value in the pivot.
I.e. “$1 + $2 + $3 + $4 + … + $n”
If you know the number of dimension members your query will fetch (more or less precisely) you won’t face any big issues. If you write “$1 + $2 + $3″ and your query only fetches 2 members then the calc will wotk nevertheless.
Cheers,
Christian
Great tip Christian!
Thank you very much! Did you get rid of @ in your first name?
Thanks for the tip Christian,
Can we put navigation on calculated items? For eg. I have grouped 10 rows of my output using calculated items and named it “Group 1″, now I require a drill on “group 1″ which takes me to some other report (basically showing the individual names which form Group 1), is this possible? Can any one help me out with this please?
Christian thank you so much for the tip on using $ to make calculated field formulas dynamic. I’ve been looking for this for a long time.
Thanks.
Hi all
I want to display YTD actuals, budget and variance for a particular account of a department on one single report on dashboard page .
pl seggest me to achieve this
Thanks
Hi all
I want to display YTD actuals, budget and variance for a particular account of a department on one single report on dashboard page .There are n no of account n department
pl suggest me to achieve this
Thanks